This guide explains how to navigate the Sources & Citations dashboard in Amadora AI. This page is your command center for understanding exactly where AI models are finding information about your brand and products.
When an AI chatbot answers a user’s question, it constructs that answer using data from various websites. This dashboard identifies those websites, categorizes them, and measures how often they are used to generate answers about you.
Visualizing Your Data
At the top of the page, you will see two charts that give you an instant snapshot of your media landscape.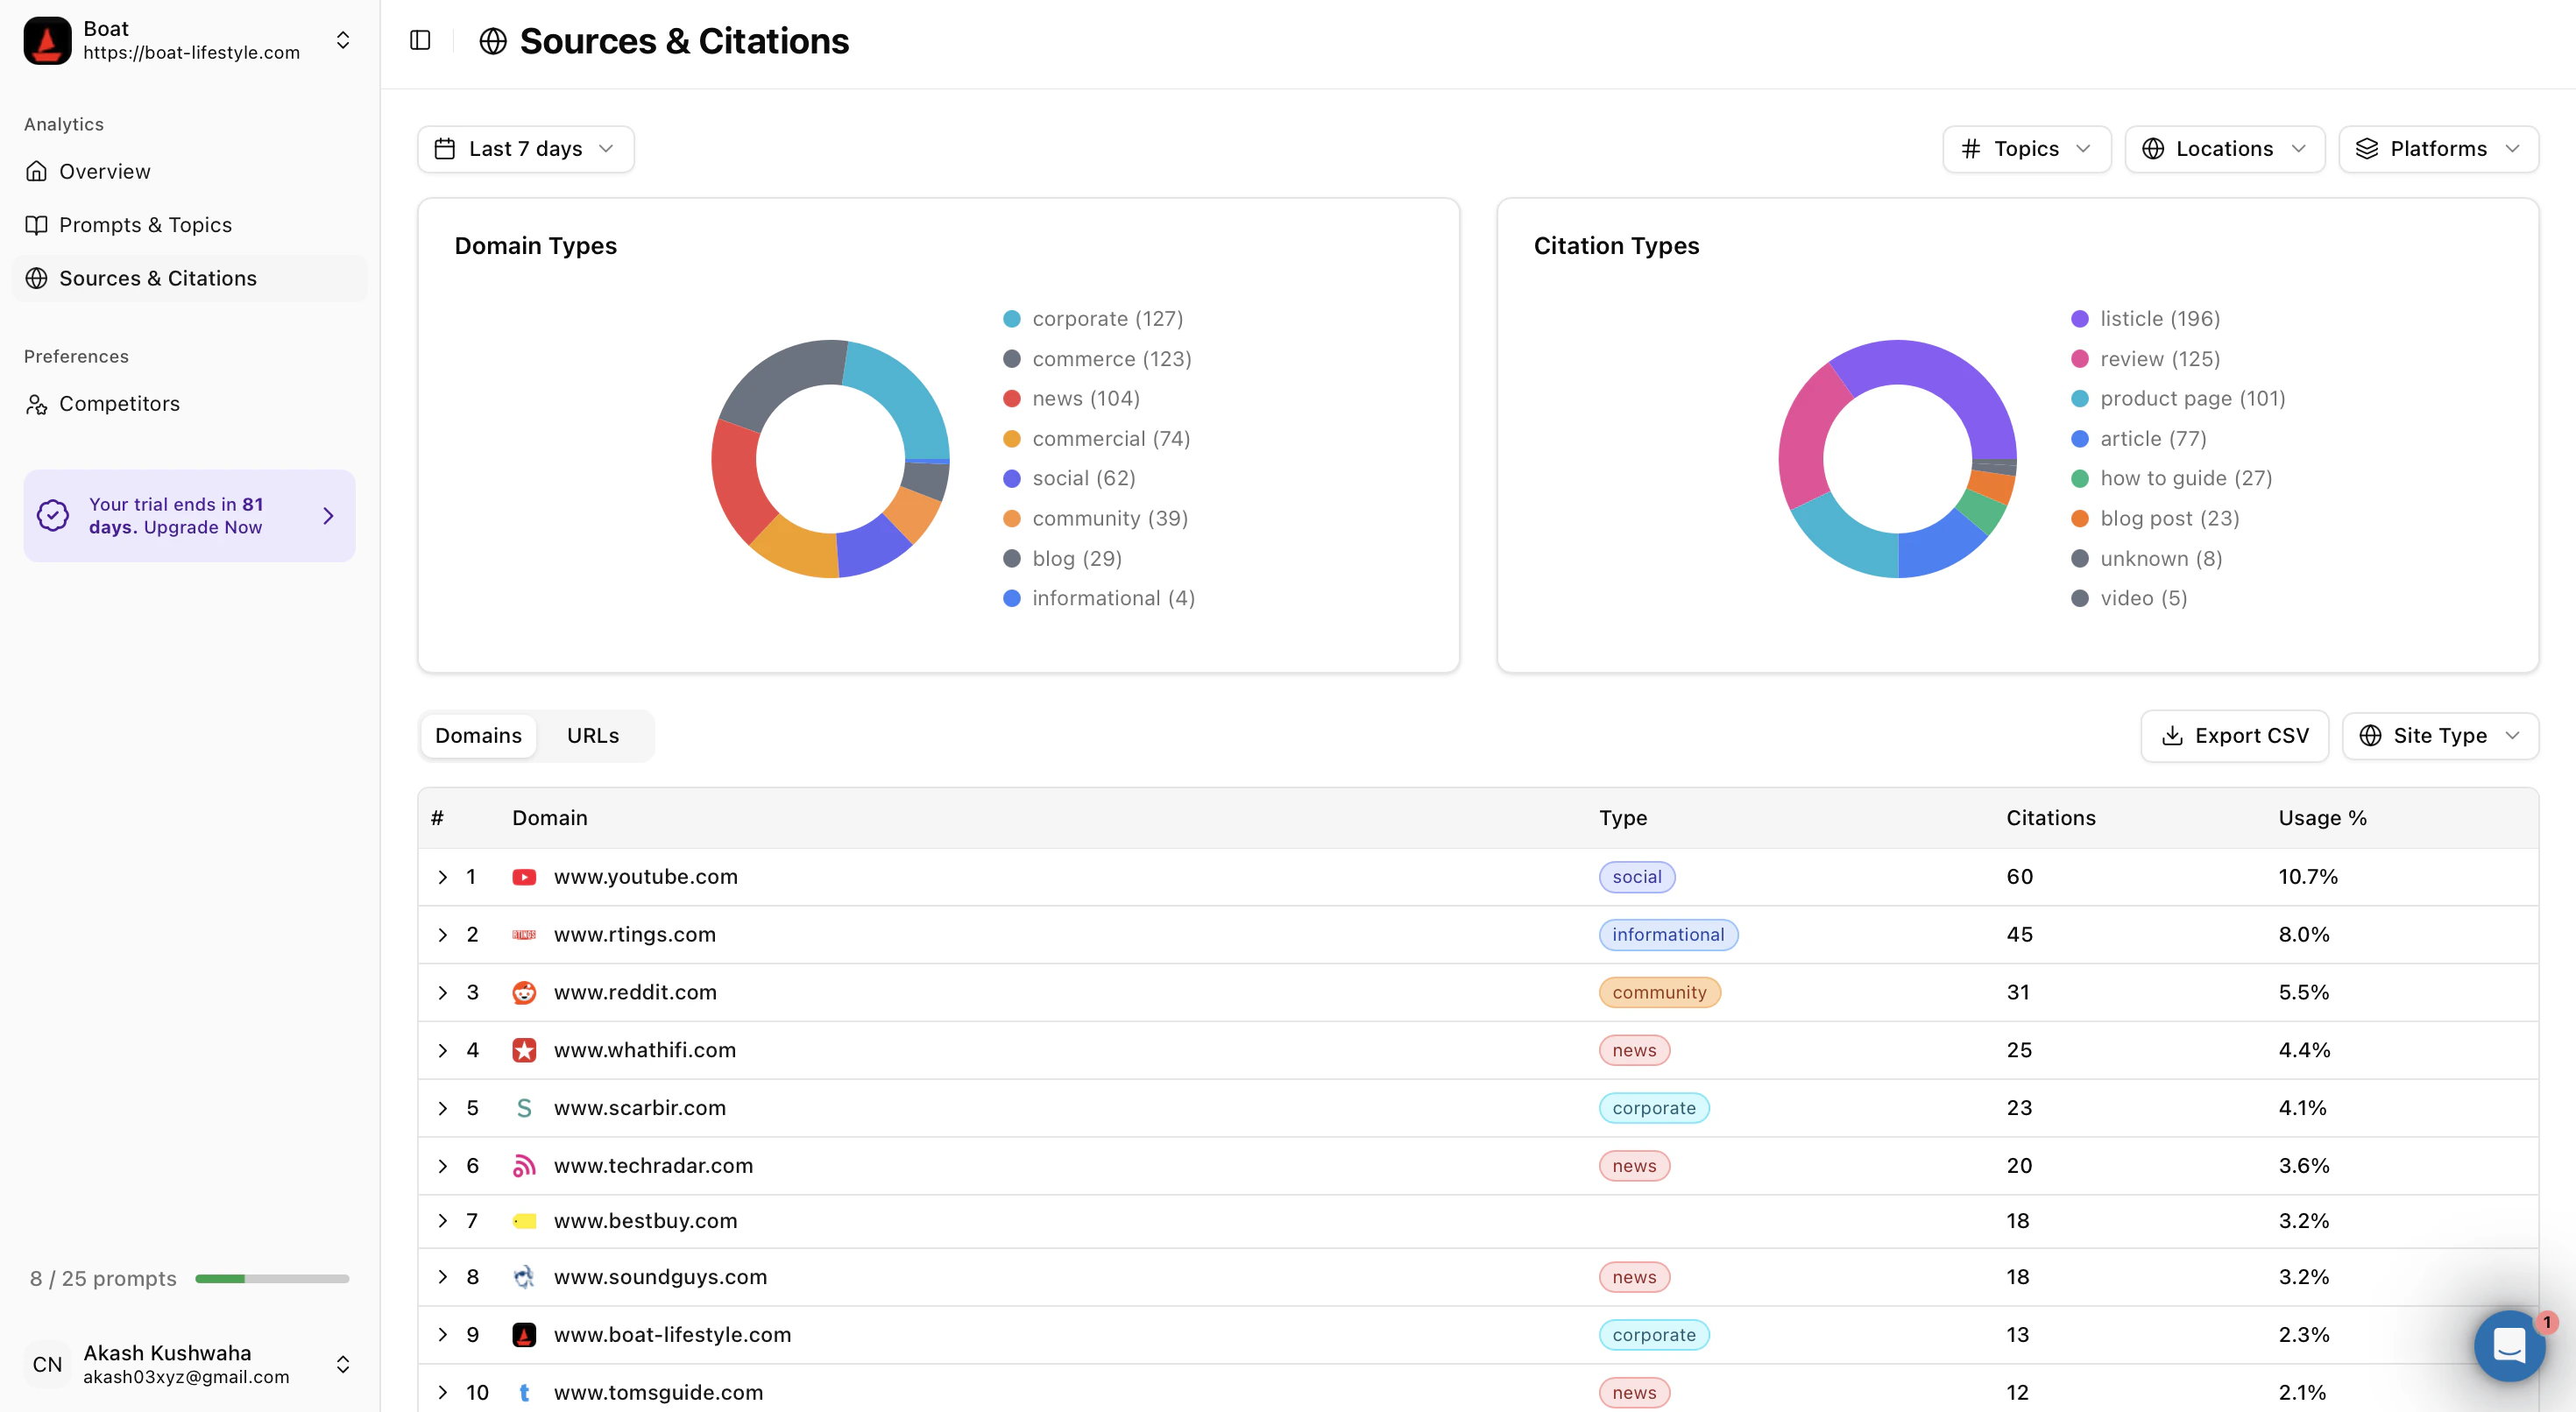
Domain Types
The “Domain Types” chart categorizes the kinds of websites referencing you.- This visual breakdown helps you spot high-level patterns in your coverage.
- You can instantly see if your brand is being discussed primarily on social platforms, news outlets, technical documentation sites, or competitor blogs.
- Hover over any section of the chart to see the exact percentage contribution from that category.
Citation Types
The “Citation Types” chart breaks down the format of the content where you appear.- This distinguishes between different styles of information, such as product reviews, “best of” lists, educational guides, or forum discussions.
- Understanding these formats helps you tailor your content strategy. For example, if you see a high volume of “Reviews,” you might focus on reputation management. If you see many “Listicles,” you might focus on competitive positioning.
Digging Deeper: Domains and URLs
Below the charts, you can toggle between two detailed views to explore your data.The Domains Tab
This view shows the “big picture.” It lists the root websites where your brand appears.- Usage %: Shows how heavily AI models rely on this specific domain for information about you.
- Type Labels: We automatically tag each domain with a category so you can quickly scan the list and understand the nature of the source.
The URLs Tab
This view offers granular precision. Instead of just seeing the website name, you will see the exact thread or page link.- You can see specific article titles and direct links to the content.
- This is useful for identifying high-value articles that you may want to amplify or finding specific discussions that need your attention.
Filters
You can refine all data on this page using the filters at the top right:- Time: View data for the last 7 days or custom ranges.
- Topics: Filter by specific themes relevant to your product.
- Locations: See data specific to regions (e.g., US vs. Europe).
Key Metrics
We provide two primary metrics to measure your success. These are displayed as trend lines so you can track growth over time.Citation Share
Definition: This percentage represents your “share of voice.” It calculates what percentage of all AI-generated answers in your industry cite your website as a source.- Why it matters: A higher percentage means you are becoming a dominant authority in your market.
Citation Count
Definition: This is the raw number of times your website was cited in AI-generated answers during the selected period.- Why it matters: This measures volume. Even if your percentage share is steady, a rising count means the total conversation around your topic is growing.
Owned Citations
At the bottom of the dashboard, you will find the Owned Citations section. While the rest of the dashboard shows external mentions (what others say about you), this section tracks your direct contribution.- It lists the specific pages from your own website (e.g., your blog posts, documentation, or landing pages) that AI models are using as facts.
- Use this to verify that AI models are reading your official documentation and latest product updates correctly.