> ## Documentation Index
> Fetch the complete documentation index at: https://docs.amadora.ai/llms.txt
> Use this file to discover all available pages before exploring further.
# GSC Integration
Amadora shows you how you're doing in AI search. Connect **Google Search Console (GSC)** and the AI Agent can also see how you're doing in *traditional* Google search — and, more importantly, do the analysis for you.
Instead of exporting thousands of rows and building pivot tables, you just ask the Agent a question. Behind the scenes it pulls large samples from GSC (tens of thousands of rows), filters out the noise, ranks what matters, and hands you a clean, ready-to-act answer. You get insight, not a data dump.
This article covers what the integration unlocks, how to connect it, and each of the 7 built-in GSC skills in detail — with example prompts you can copy and adapt.
## Why connect GSC
**One place for both sides of search.** Your AI visibility (Amadora) and your organic Google performance (GSC) live side by side, so the Agent can connect the dots between them.
**The analysis is done for you.** The Agent doesn't just fetch raw GSC data. For each question it computes the deltas, builds the CTR curves, scores the conflicts, and ranks the winners — server-side. You get the conclusion and the evidence behind it, not a spreadsheet to wrangle.
**It answers real questions, fast.** "Is traffic up or down?" "What dropped?" "Where are we leaving clicks on the table?" "Are these pages indexed?" — all answered in plain language, backed by your own data.
## How to connect Google Search Console
1. In your project, go to **Brand Settings → Connections**.
2. Find **Google Search Console** and connect your Google account.
3. Select the **property** (site) you want to analyze — for example, `yourdomain.com`.
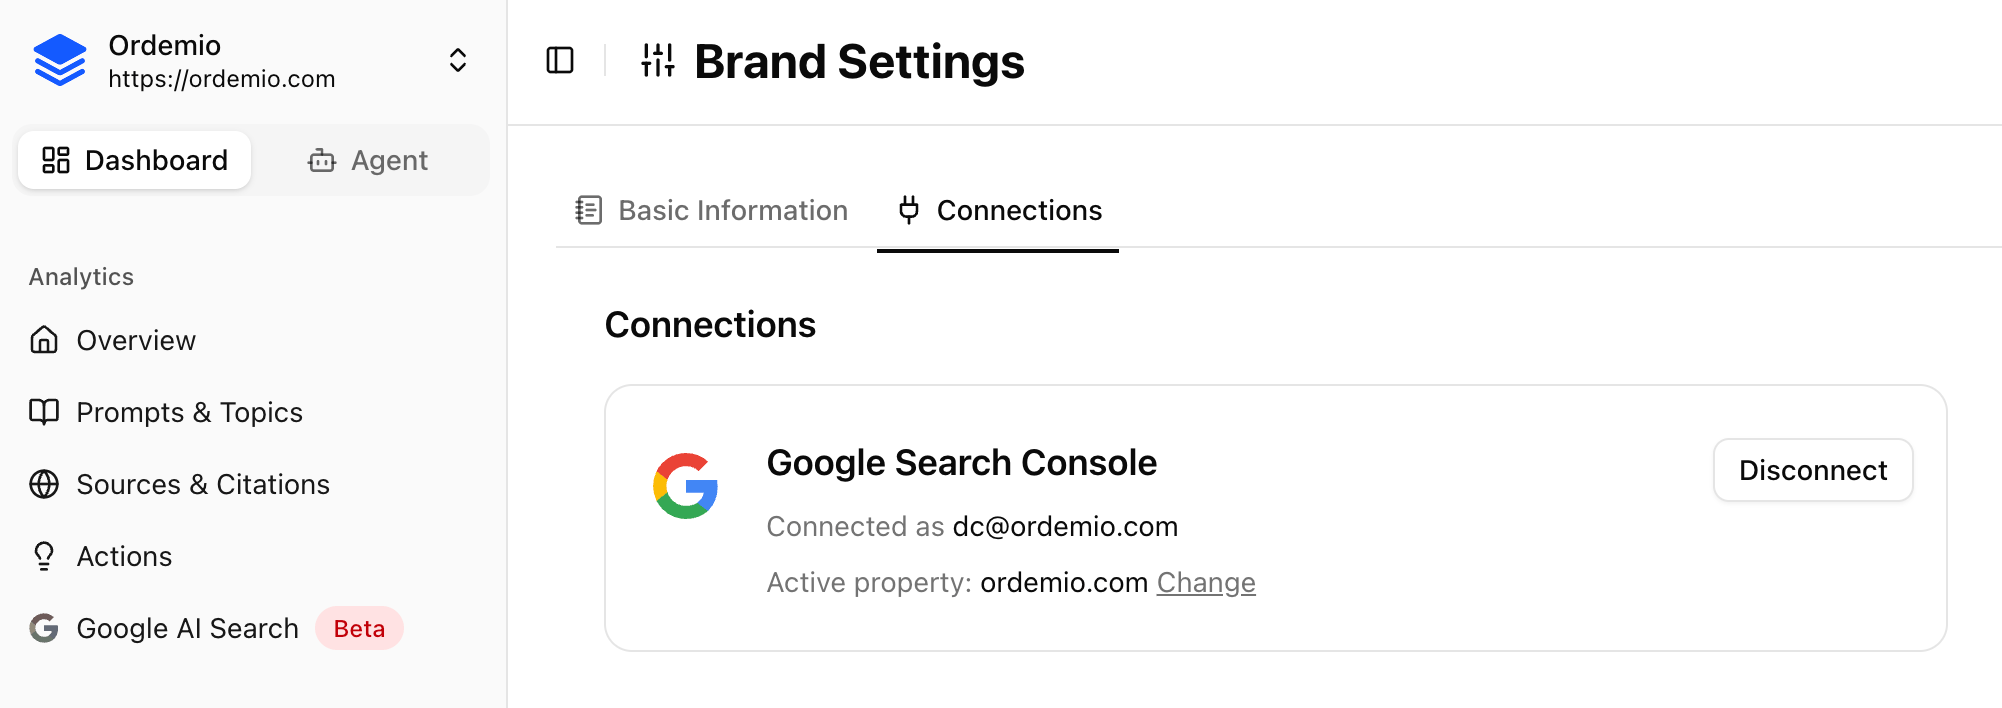 That's it. Once connected, the Agent can pull GSC data on demand. If GSC isn't connected, the Agent will simply prompt you to connect it rather than guessing.
**A couple of things worth knowing:**
* **Reporting window.** By default the Agent looks at the last **28 days**, compared against the equal prior period, with a **3-day lag** (GSC data is always delayed by a few days).
* **You get evidence, not exports.** The Agent processes large GSC samples but only surfaces ranked, relevant rows — this keeps answers fast, focused, and accurate.
## The 7 GSC skills
Each skill answers a specific kind of question. You don't need to name the skill — just ask naturally, and the Agent picks the right one.
### 1. Performance overview — "How is organic doing?"
A site-wide pulse check on your organic search. The Agent pulls aggregate KPIs — clicks, impressions, CTR, and average position — for the current period and the prior one, computes the period-over-period change, and builds a trend line. It's the fastest way to see whether things are moving up or down overall (no query- or page-level breakdown — site totals only).
**Use it when you want to know:**
* *"How is our organic traffic doing?"*
* *"Are clicks and impressions up or down this month?"*
* *"Give me a GSC overview for the last 28 days and tell me what changed."*
### 2. Movers — "What exactly grew or dropped?"
When the overview shows a change, this tells you *what caused it*. The Agent compares your queries (or pages) across both periods, filters out low-impression noise, and computes an **impact score** for each — how strongly that shift moved your results. You get a ranked list of your biggest winners and losers, not the whole catalog.
**Use it when you want to know:**
* *"Which queries gained the most clicks this month?"*
* *"Which pages dropped the most, and by how much?"*
* *"Show me the top winners and losers for the last period."*
Default is the top 25 movers (up to 100).
### 3. CTR opportunities — "Where are we leaving clicks on the table?"
Finds queries or pages that **rank reasonably well but under-click** — usually a title or snippet problem you can fix. The clever part: the Agent builds an **expected CTR curve from your own site's data** (not a generic industry benchmark), compares your actual CTR against it, estimates the missed clicks, and ranks the biggest opportunities. If there isn't enough data to build a reliable curve, it tells you instead of inventing a number.
**Use it when you want to know:**
* *"Where is my CTR below what's expected for the position?"*
* *"Which queries in positions 4–20 are missing clicks?"*
* *"Where are my biggest missed-click opportunities?"*
### 4. Cannibalization — "Are my own pages competing?"
Finds queries where **multiple pages on your site compete** with each other in search results — splitting the same keyword and weakening your ranking. The Agent groups page×query pairs, keeps only queries where two or more pages have meaningful impressions, and scores each conflict (more impressions + a more even split across URLs = higher conflict), with up to 5 example URLs per conflict.
**Use it when you want to know:**
* *"Where do I have keyword cannibalization?"*
* *"Which queries have multiple competing URLs?"*
* *"Which pages are splitting the same keyword?"*
### 5. Entity details — "Break down this one query or page"
A focused drill-down into a **single** query or page. The Agent loads its KPIs for the current and prior periods plus the delta, and returns a related list: for a query, the pages that show up for it; for a page, the queries that drive traffic to it. Perfect for investigating one thing in depth without pulling the whole site.
**Use it when you want to know:**
* *"How is the query 'crm software' performing?"*
* *"Which queries drive traffic to my /pricing page?"*
* *"Break down this page in more detail."*
Related entities are sorted by clicks and capped at 25 by default.
### 6. URL inspection — "Are these pages indexed?"
Checks the **indexing status** of specific URLs in Google (using the URL Inspection API). Give the Agent a list of URLs and it classifies each one — indexed, discovered but not indexed, crawled but not indexed, blocked, or error — and returns totals by status. It surfaces the *problem* URLs with reasons, so you immediately see what needs fixing rather than scrolling past the pages that are fine.
**Use it when you want to know:**
* *"Are these pages indexed?"* (paste your URLs)
* *"Why isn't this URL indexed?"*
* *"Check the indexing status of my main landing pages."*
Accepts up to 20 URLs by default (hard cap 50).
### 7. Full report — "Give me the whole picture"
One call that combines four skills into a single composite organic report: **site-wide overview + top winners and losers + CTR opportunities + cannibalization conflicts.** It uses the same analyzers as the dedicated skills but shares the underlying data fetches, so it stays fast and predictable. This is the one to reach for when you want the complete state of organic search in a single, shareable brief.
**Use it when you want to know:**
* *"Give me a full GSC report."*
* *"In short — how is organic doing: growth, drops, CTR, and URL conflicts?"*
Each section is capped at 25 rows by default.
## Putting it together
The real power comes from combining GSC with your Amadora visibility data. Because the Agent sees both, you can ask questions that bridge the two worlds:
* *"Compare my AI visibility with my organic Google performance — where are the biggest gaps?"*
* *"Which topics am I winning in AI search but losing in organic Google, and vice versa?"*
* *"Build me a monthly search report covering both AI visibility and GSC, with recommended next steps."*
***
Connect GSC in **Brand Settings → Connections**, open the **Agent** tab, and ask it something you'd normally dig through the Search Console dashboard for. The answer — and the reasoning behind it — comes back in seconds.
That's it. Once connected, the Agent can pull GSC data on demand. If GSC isn't connected, the Agent will simply prompt you to connect it rather than guessing.
**A couple of things worth knowing:**
* **Reporting window.** By default the Agent looks at the last **28 days**, compared against the equal prior period, with a **3-day lag** (GSC data is always delayed by a few days).
* **You get evidence, not exports.** The Agent processes large GSC samples but only surfaces ranked, relevant rows — this keeps answers fast, focused, and accurate.
## The 7 GSC skills
Each skill answers a specific kind of question. You don't need to name the skill — just ask naturally, and the Agent picks the right one.
### 1. Performance overview — "How is organic doing?"
A site-wide pulse check on your organic search. The Agent pulls aggregate KPIs — clicks, impressions, CTR, and average position — for the current period and the prior one, computes the period-over-period change, and builds a trend line. It's the fastest way to see whether things are moving up or down overall (no query- or page-level breakdown — site totals only).
**Use it when you want to know:**
* *"How is our organic traffic doing?"*
* *"Are clicks and impressions up or down this month?"*
* *"Give me a GSC overview for the last 28 days and tell me what changed."*
### 2. Movers — "What exactly grew or dropped?"
When the overview shows a change, this tells you *what caused it*. The Agent compares your queries (or pages) across both periods, filters out low-impression noise, and computes an **impact score** for each — how strongly that shift moved your results. You get a ranked list of your biggest winners and losers, not the whole catalog.
**Use it when you want to know:**
* *"Which queries gained the most clicks this month?"*
* *"Which pages dropped the most, and by how much?"*
* *"Show me the top winners and losers for the last period."*
Default is the top 25 movers (up to 100).
### 3. CTR opportunities — "Where are we leaving clicks on the table?"
Finds queries or pages that **rank reasonably well but under-click** — usually a title or snippet problem you can fix. The clever part: the Agent builds an **expected CTR curve from your own site's data** (not a generic industry benchmark), compares your actual CTR against it, estimates the missed clicks, and ranks the biggest opportunities. If there isn't enough data to build a reliable curve, it tells you instead of inventing a number.
**Use it when you want to know:**
* *"Where is my CTR below what's expected for the position?"*
* *"Which queries in positions 4–20 are missing clicks?"*
* *"Where are my biggest missed-click opportunities?"*
### 4. Cannibalization — "Are my own pages competing?"
Finds queries where **multiple pages on your site compete** with each other in search results — splitting the same keyword and weakening your ranking. The Agent groups page×query pairs, keeps only queries where two or more pages have meaningful impressions, and scores each conflict (more impressions + a more even split across URLs = higher conflict), with up to 5 example URLs per conflict.
**Use it when you want to know:**
* *"Where do I have keyword cannibalization?"*
* *"Which queries have multiple competing URLs?"*
* *"Which pages are splitting the same keyword?"*
### 5. Entity details — "Break down this one query or page"
A focused drill-down into a **single** query or page. The Agent loads its KPIs for the current and prior periods plus the delta, and returns a related list: for a query, the pages that show up for it; for a page, the queries that drive traffic to it. Perfect for investigating one thing in depth without pulling the whole site.
**Use it when you want to know:**
* *"How is the query 'crm software' performing?"*
* *"Which queries drive traffic to my /pricing page?"*
* *"Break down this page in more detail."*
Related entities are sorted by clicks and capped at 25 by default.
### 6. URL inspection — "Are these pages indexed?"
Checks the **indexing status** of specific URLs in Google (using the URL Inspection API). Give the Agent a list of URLs and it classifies each one — indexed, discovered but not indexed, crawled but not indexed, blocked, or error — and returns totals by status. It surfaces the *problem* URLs with reasons, so you immediately see what needs fixing rather than scrolling past the pages that are fine.
**Use it when you want to know:**
* *"Are these pages indexed?"* (paste your URLs)
* *"Why isn't this URL indexed?"*
* *"Check the indexing status of my main landing pages."*
Accepts up to 20 URLs by default (hard cap 50).
### 7. Full report — "Give me the whole picture"
One call that combines four skills into a single composite organic report: **site-wide overview + top winners and losers + CTR opportunities + cannibalization conflicts.** It uses the same analyzers as the dedicated skills but shares the underlying data fetches, so it stays fast and predictable. This is the one to reach for when you want the complete state of organic search in a single, shareable brief.
**Use it when you want to know:**
* *"Give me a full GSC report."*
* *"In short — how is organic doing: growth, drops, CTR, and URL conflicts?"*
Each section is capped at 25 rows by default.
## Putting it together
The real power comes from combining GSC with your Amadora visibility data. Because the Agent sees both, you can ask questions that bridge the two worlds:
* *"Compare my AI visibility with my organic Google performance — where are the biggest gaps?"*
* *"Which topics am I winning in AI search but losing in organic Google, and vice versa?"*
* *"Build me a monthly search report covering both AI visibility and GSC, with recommended next steps."*
***
Connect GSC in **Brand Settings → Connections**, open the **Agent** tab, and ask it something you'd normally dig through the Search Console dashboard for. The answer — and the reasoning behind it — comes back in seconds.